CityScope An AR App for Visualizing Open Weather Data 2023
Cooperative works
Pei-Chi Tsai | Yu-hsuan Lo | Ching-Yao Su
X
City Science Lab@Taipei Tech

CityScope AR will use augmented reality to achieve a real-time 3D weather demonstration of Taiwan as a short-term development goal. The project will continue to integrate and utilize sensors in the process to enable interaction between Taiwan and the general public.
#CityScience #AR app #Visualization #Localization #iOS system #OpenData #Real-Time
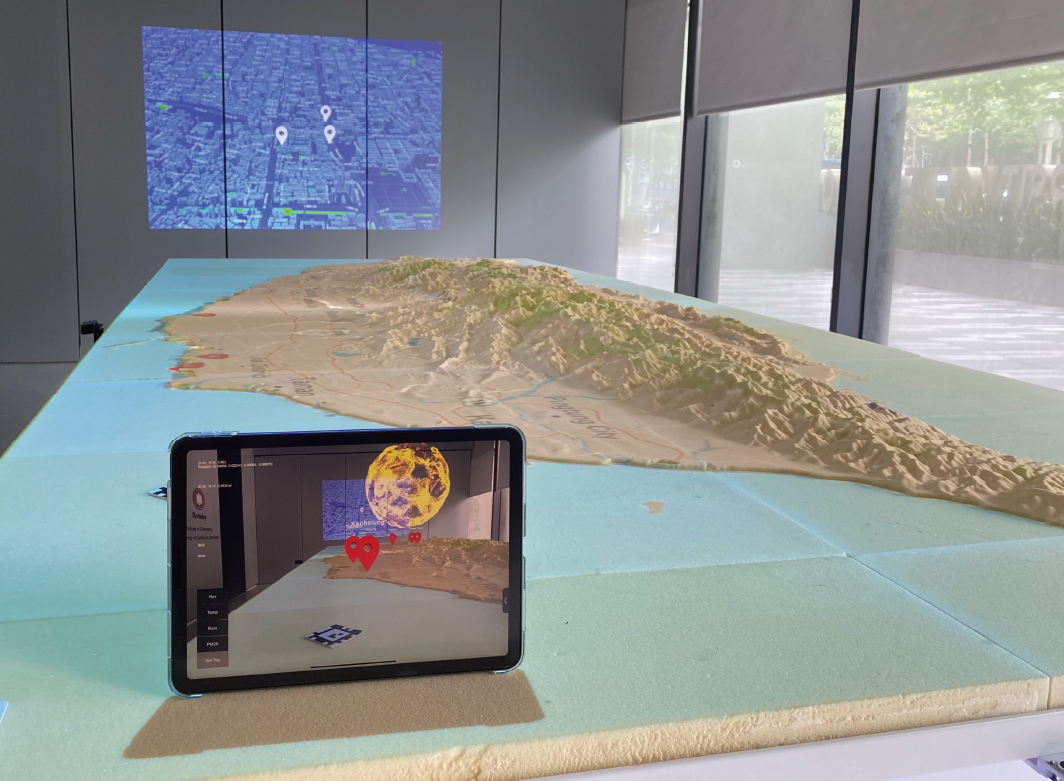
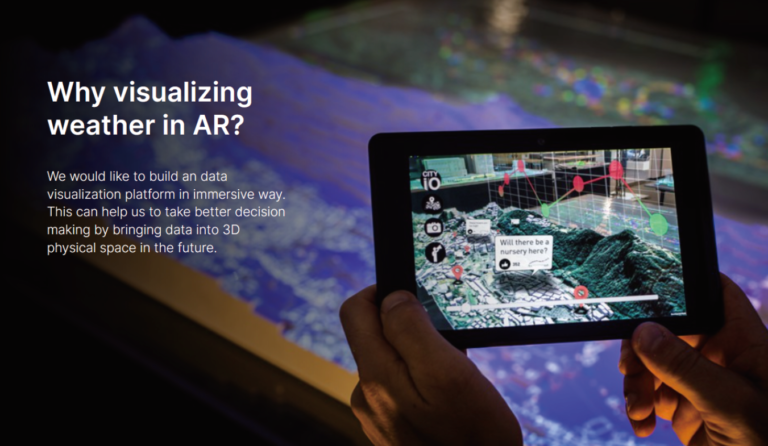
Concept
The app visualizes open weather data from the Central Weather Bureau (CWB), such as UV index, rainfall, temperature, and PM2.5 levels from Environmental Protection Agency (EPA). The virtual objects in the app are divided into two parts:
1. Upper Sphere (Main Visual Element):
Designed to resemble a weather globe, it shows particle changes inside to represent different weather conditions.
2. Lower Object (Informational Aid):
Displays data metrics and the names of cities or counties.

Data Visualization
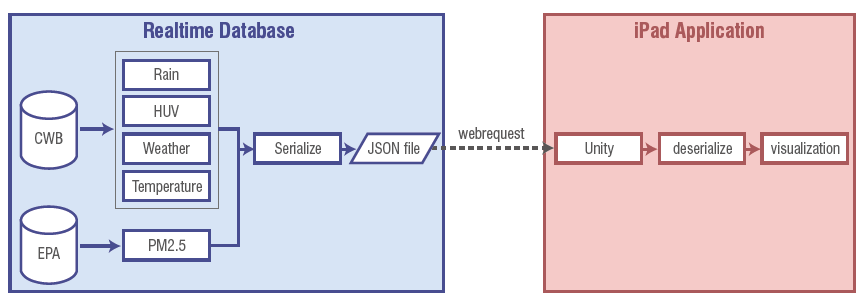
The system is divided into two main frameworks.
1. The first framework, indicated by the blue area, receives real-time information from backend APIs in JSON format.
2. The second framework, represented by the red area, uses web requests to wirelessly transmit this data to an iPad running Unity. Once received, the data undergoes JSON deserialization and is then visually represented in a corresponding manner.

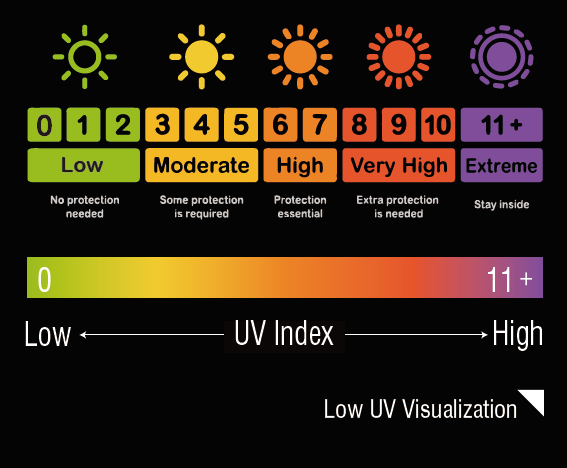
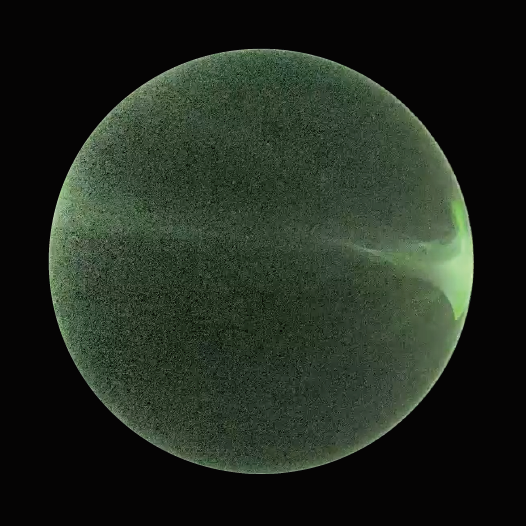
The ultraviolet (UV) effects are designed based on the UV index, with particle colors also planned according to the color scheme of the UV index. The index ranges from 0 to 11+, with colors transitioning from green topurple to indicate the level of UV exposure, from low to high.

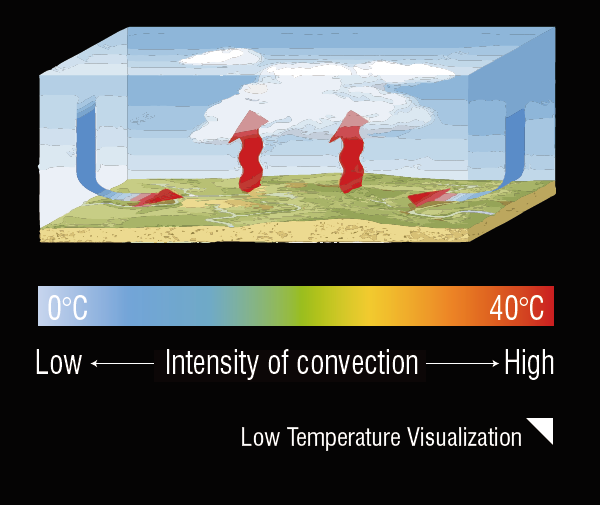
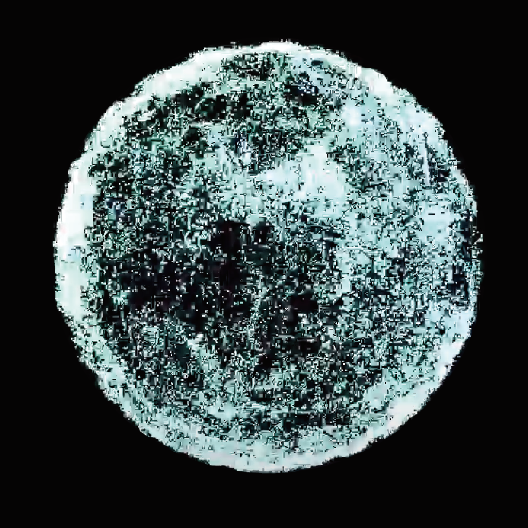
The temperature effects aims to represent the intensity of convection currents. The color scheme ranges from blue to indicate cold temperatures to red for hot temperatures. The stronger the convection, the colder the temperature is represented, and conversely, weaker convection corresponds to hotter temperatures

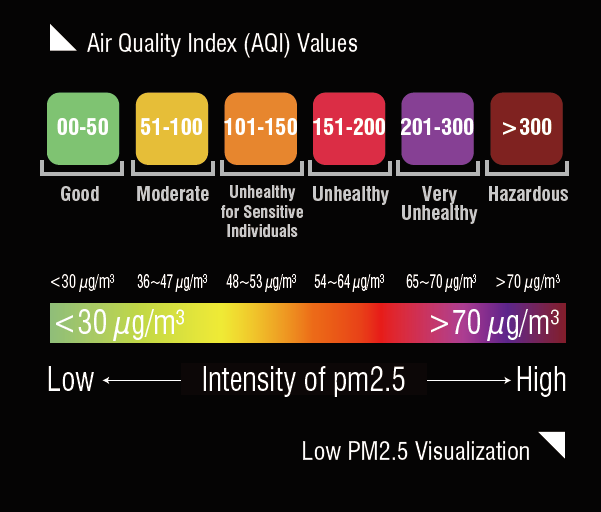
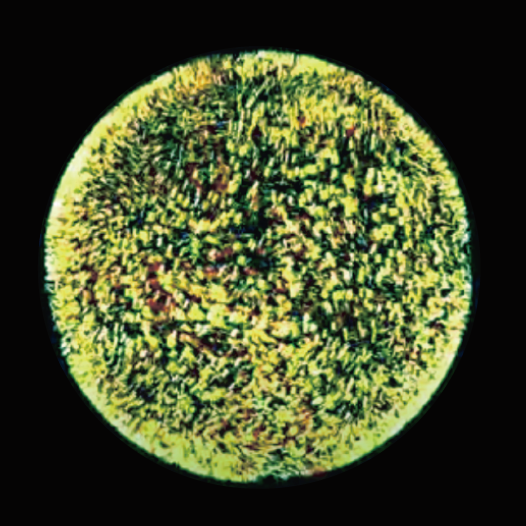
The PM2.5 effects are designed to indicate the concentration level of fine particulate matter in the air. A denser concentration is represented by a deeper shade of brown, while a sparser concentration is indicated by a lighter shade of green.

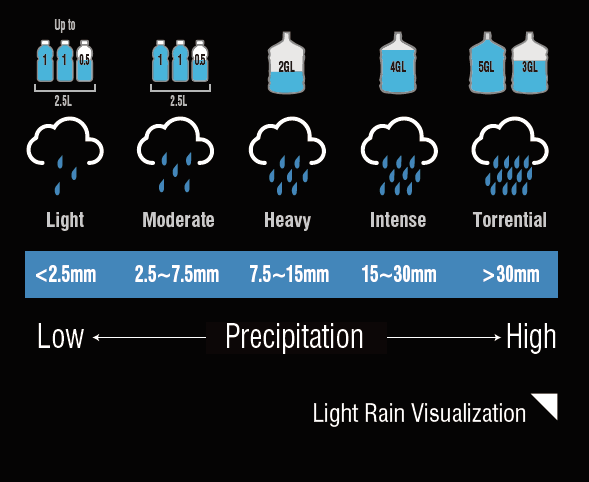
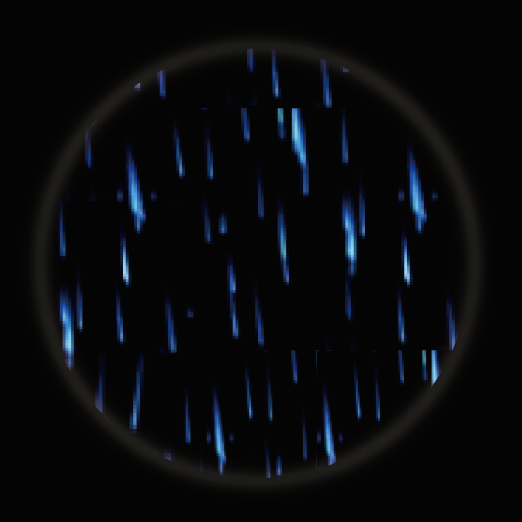
The rain effects are influenced by the real-time rainfall data received. The higher the numerical value of the rainfall, the denser the particle effects for rain appear, and conversely, lower values result in sparser rain effects.
Localization
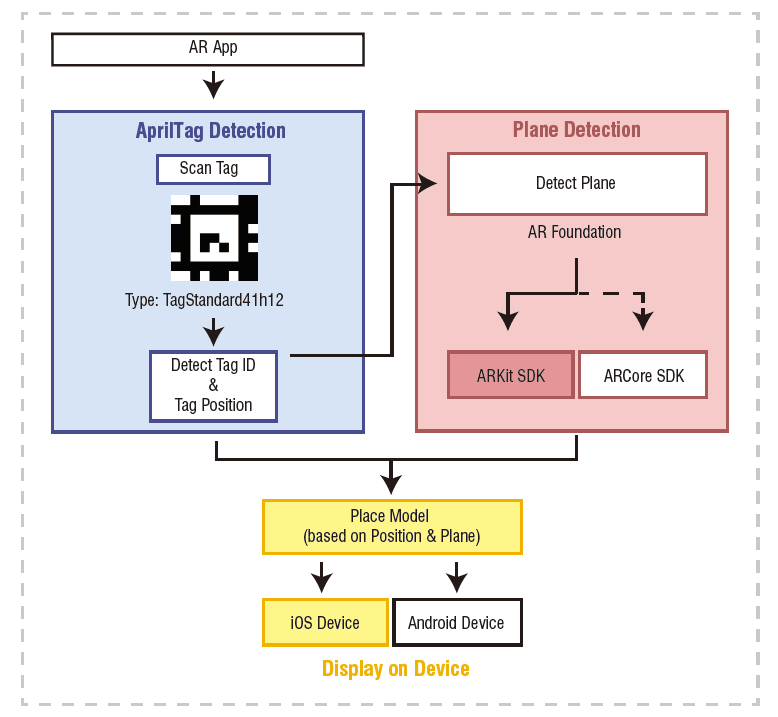
In order to accurately position the model on the physical Taiwan Island replica, the system is organized into two primary modules.
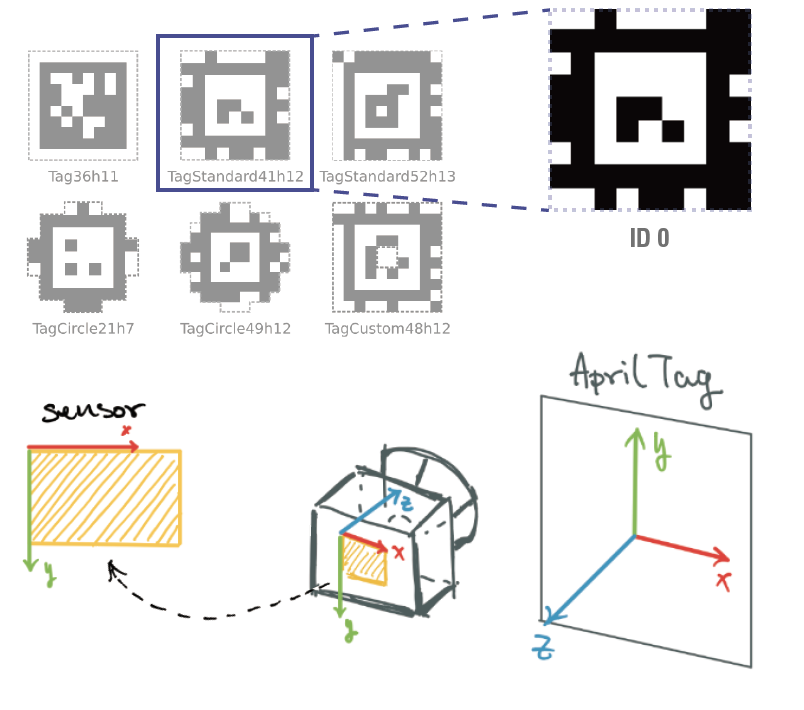
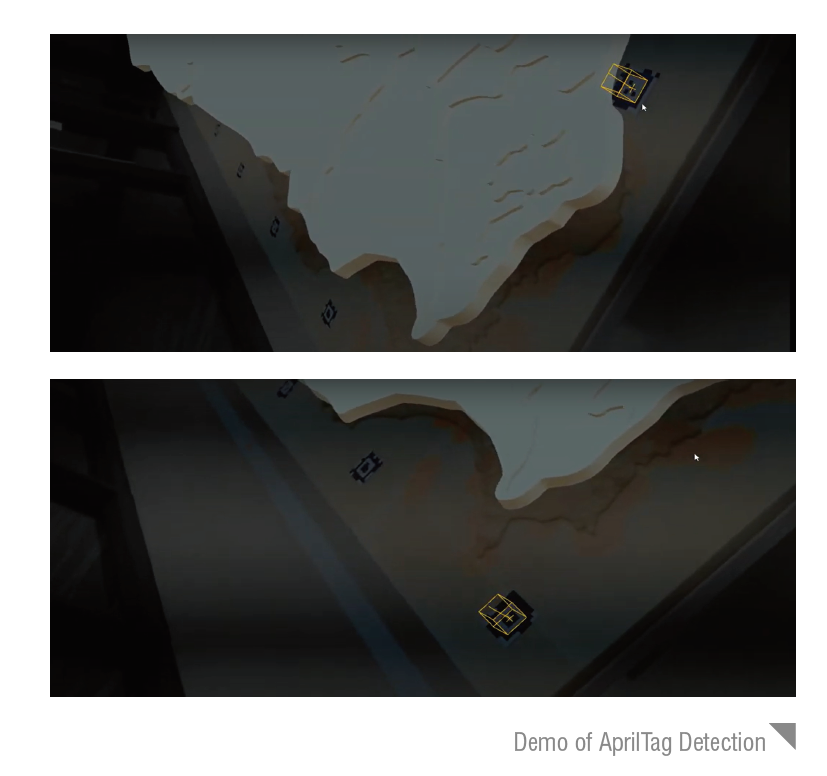
1. The first module, highlighted in blue, employs AprilTag Detection using the TagStandard41h12 type to scan and identify the tag ID as well as its position.
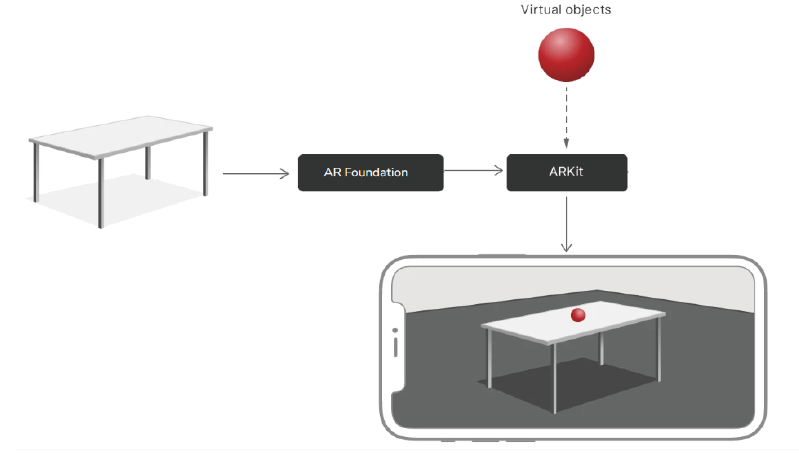
2. The second module, marked in red, utilizes AR Foundation for plane detection.
This module offers ARKit SDK for iOS devices and ARCore SDK for Android devices. Specifically, we use the ARKit SDK for iOS to place the model based on the detected tag position and plane, which is then displayed on the device.

Demo Video

CrowdPrediction
CityScience, ComputerScience, Project
CityScope
CityScience, Project
SmartHygiene+
CityScience, Project
UrbanSight
ArchitectureDesign, CityScience, ExtendedReality, Project, Research
NonEuclidean Geometry
ExtendedReality, Project
