Crowd Prediction Pedestrian flow Prediction Dashboard 2022
Cooperative works
Pei-Chi Tsai | Shih-Yu Lai | Tomohide Hashida | Po-Hsun Chang
X
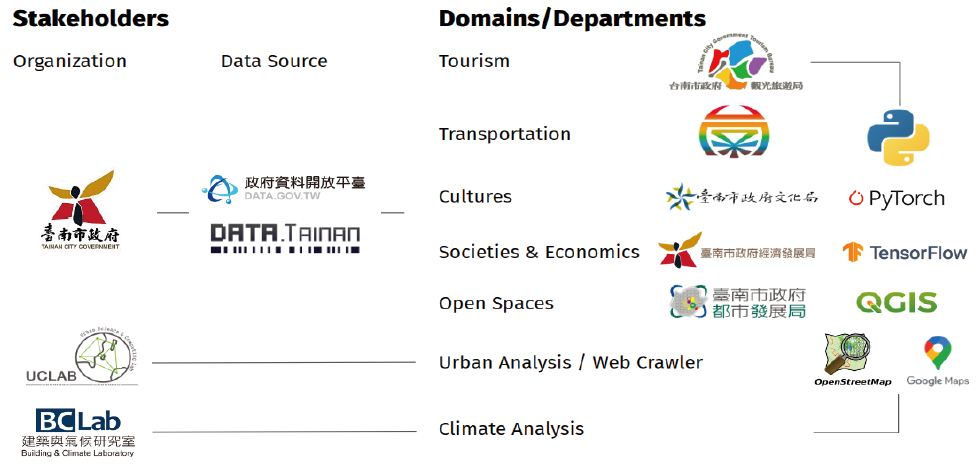
Tourism Bureau of Tainan City Government

We analyze the pedestrian flow pattern through various data and use the telecommunication data as the research evidence, and then use machine learning to predict the pedestrian flow and display it on the web interface. We define a valid and feasible estimation method as a reference for the study in case of sufficient data.
#CityScience #WebSystem #Prediction
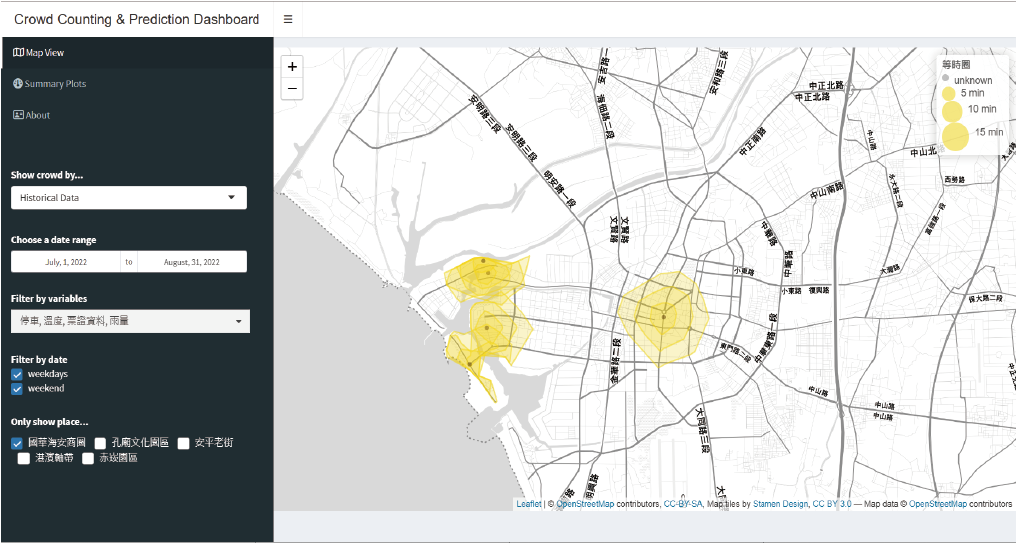
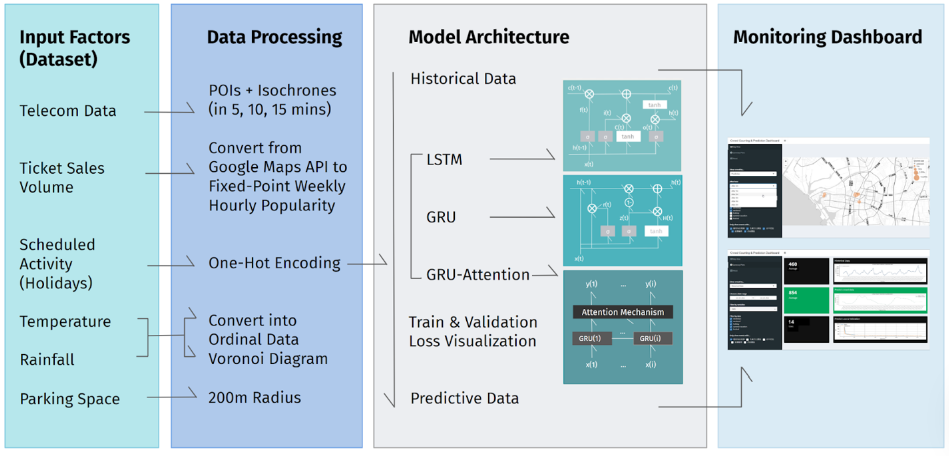
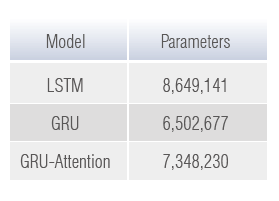
The escalating urban population had resulted in social and safety challenges. Therefore, effectively managing crowd congestion in densely populated cities became of utmost importance in urban governance. In order to address urban challenges, we proposed a management model based on the GRU time-series model, integrating data from telecommunications, ticket sales, events, weather observations, and parking availability to predict and control urban crowds. In this study, GRU model outperformed LSTM and GRU-Attention models due to its efficiency. Taking six types of hourly data from the past 48 hours as input, it forecasted tourist flow at attractions five hours ahead. Additionally, a visualization system was developed to allow users to analyze historical data, specific attractions, and prediction times. The proposed system offered valuable tools for urban crowd management, facilitating informed decision-making, resource allocation, and efficient governance and tourism activities.
➊ Collecting Data
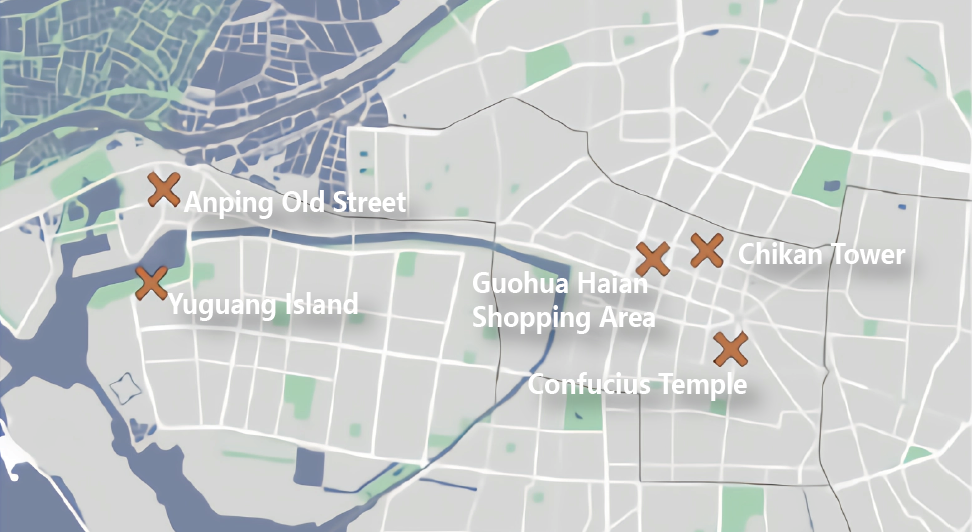
The study domain of this study is defined as 5 tourist attractions in Tainan City based on the adequacy of data, including Chikan Tower, Confucius Temple, Guohua Haian Shopping Area, Anping Street and Harborfront.

The signaling data obtained from the telecommunication company are: the hourly traffic volume and travel chain of Anping Old Street, Yuguang Island, Guohua Haian Shopping Area, Chikan Tower, and Confucius Temple (5 Attractions) in July and August 2022 (the travel chain was not used after evaluation due to its low reference value), so the following section will use this time zone as the target.
In order to establish a valid and accurate prediction model, the following is a stocktaking of the relevant factors that “may affect” or “may be affected by” the visitor flow, and then the factors are selected according to the ease of data acquisition, and then the data are analyzed and tested in the prediction model. We have initially categorized the factors that may affect the crowds intuitively into three major items: Timeline, Weather, and Other Factors.
➋ Processing Data
To improve the accuracy of prediction, 6 types of data were utilized as input factors in this study, including historical crowd data converted by telecommunications data, attractions ticket sales volume, events and holidays schedule, weather observation data (including air temperature and rain amount), and parking space availability. These data were selected due to our hypothesis that they might directly reflect crowd size or related to people’s inclination to gather.
The data is processed for sold ticket, public events, weather (temperature, rainfall), parking space usage, and keyword searches to calculate the actual number of visitors, and also to filter out routine holiday schedules during the analysis time as a variable.
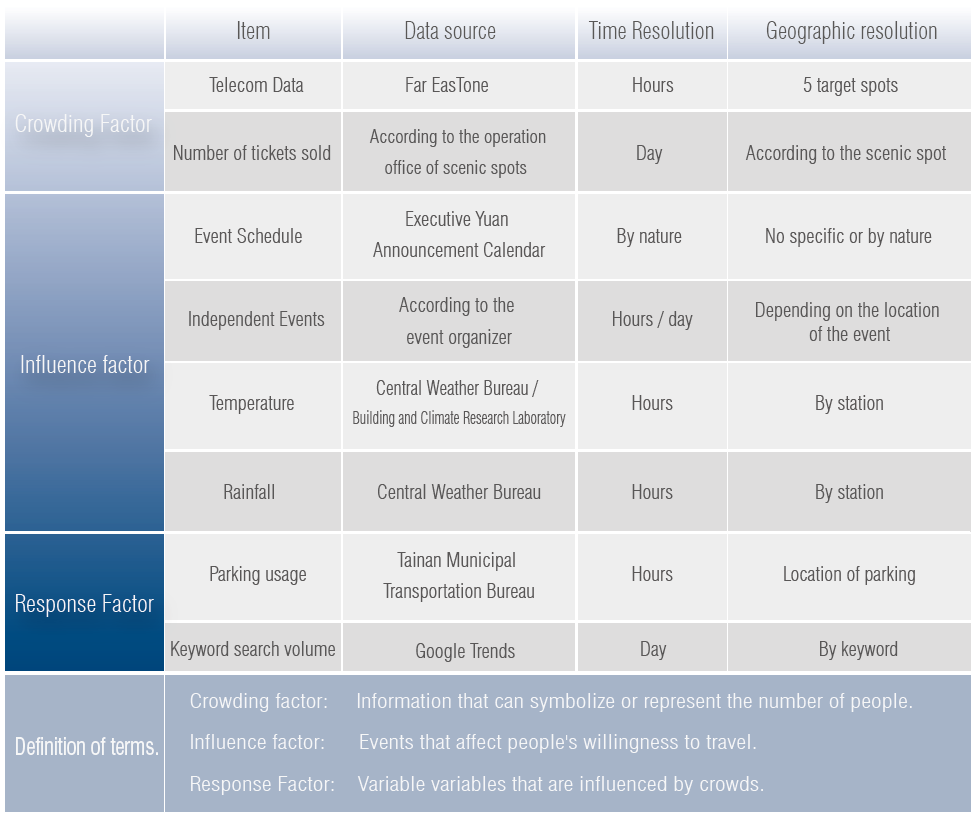

Since the modeling time resolution is hour-by-hour, the time resolution of the ticketing data should be translated to the same.
1. Google Trend was used to obtain the recent popular time rate of the scenic spot.
2. Assume that the peak and trough of the single day of the attraction is the same as July and August.
3. The time of ticket sales is deduced.
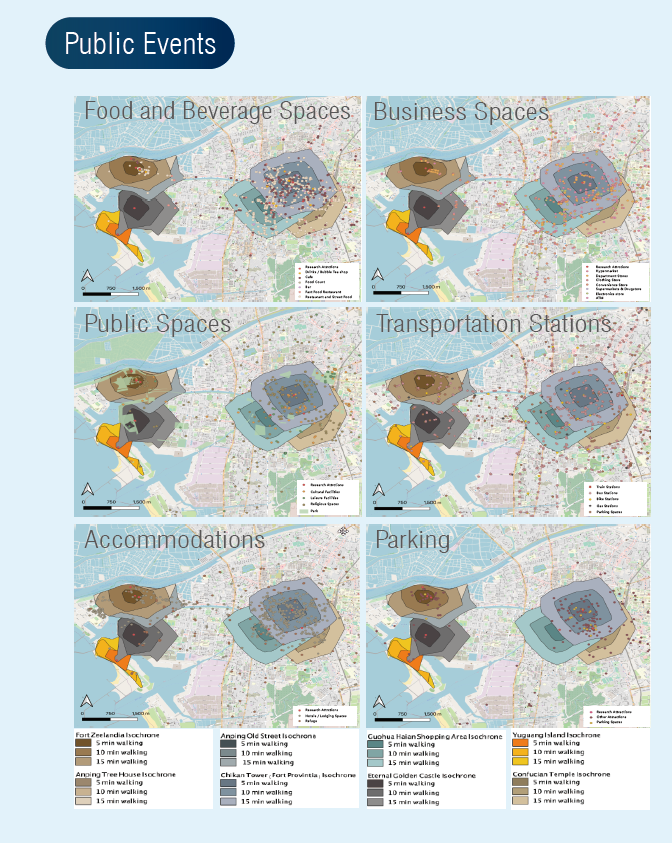
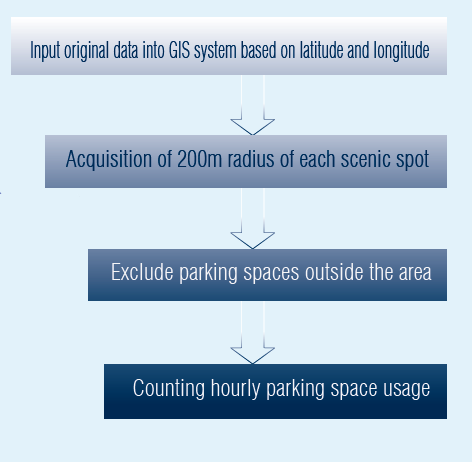
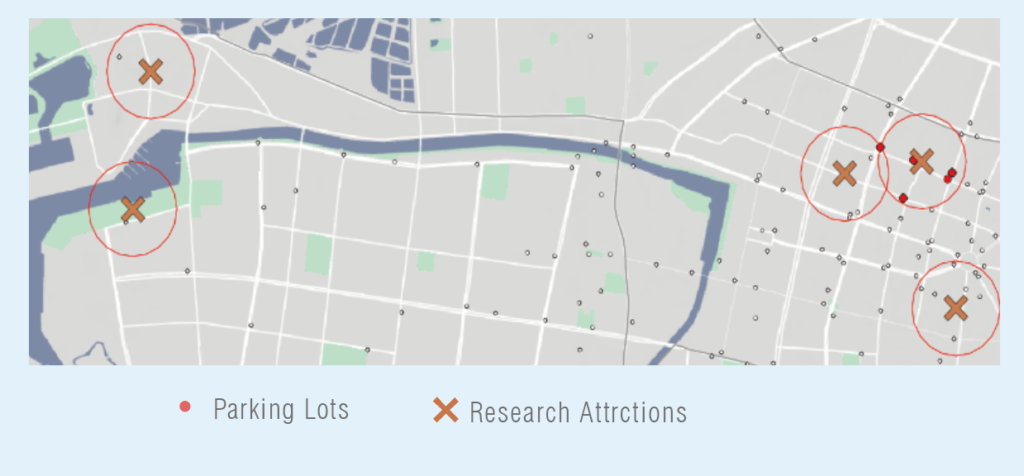
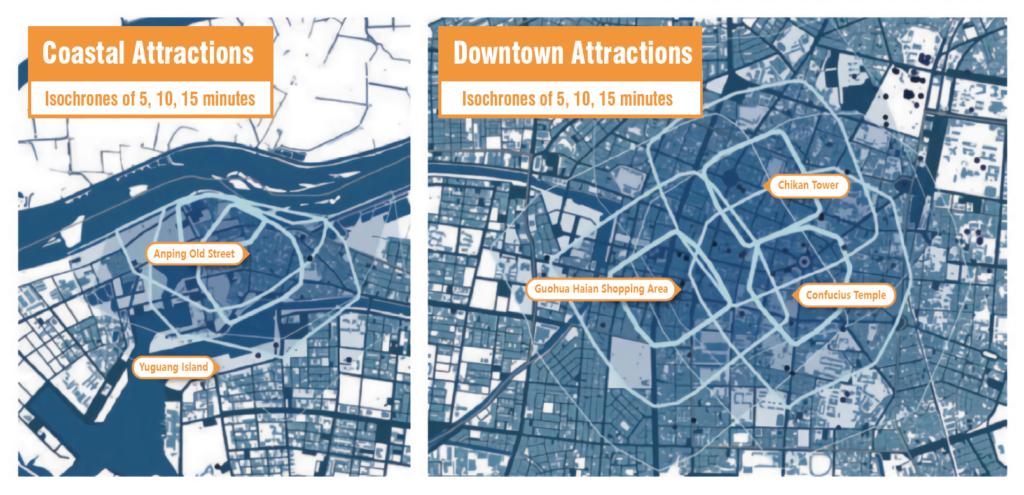
1. Using Openroute service.org to calculate the 10-minute walk time circle and define the proximity between the scenic spots and the event venues.
2. Then, we analyzed the places that might be affected by the crowd spreading from the target attraction to the surrounding areas by walking.


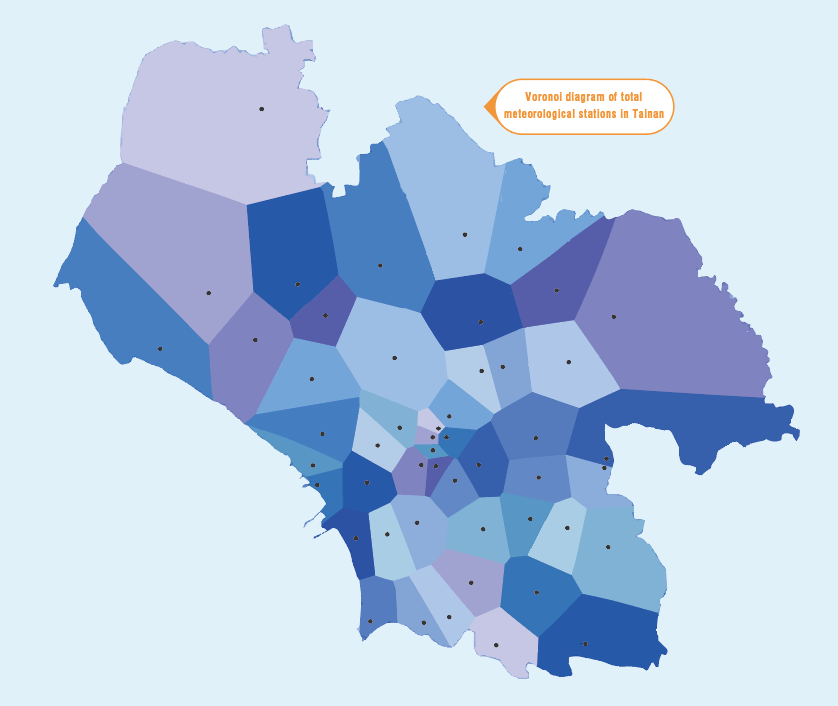
1. Define the relationship between scenic spots and corresponding stations using Voronoi Diagram to correlate the analysis.
2. Then investigate the reasonableness of the split (MAUP).
*Subsequent studies can also investigate the correlation between UV intensity, air pollution index, and other relevant factors and human influx.
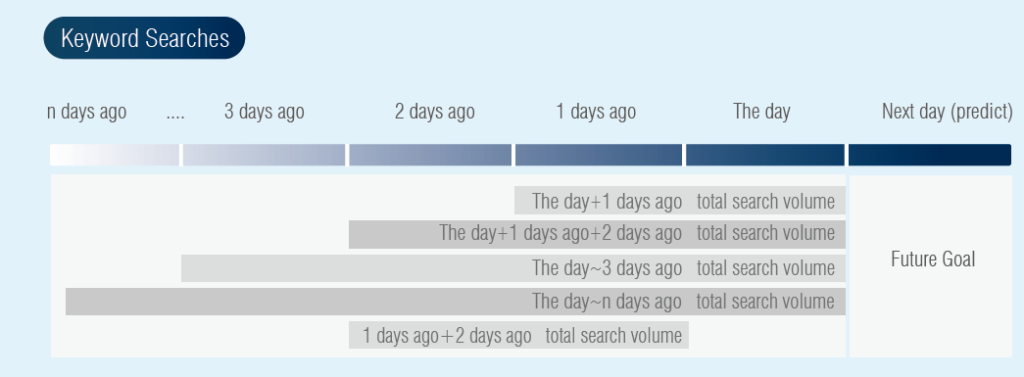
• Analysis time scale: Total number of searches on the nth day
Considering that tourists may search for local names a few days before travel, the correlation between the number of keyword searches and the number of people is analyzed through Google Trend open data.

➌ Exploratory Data Analysis
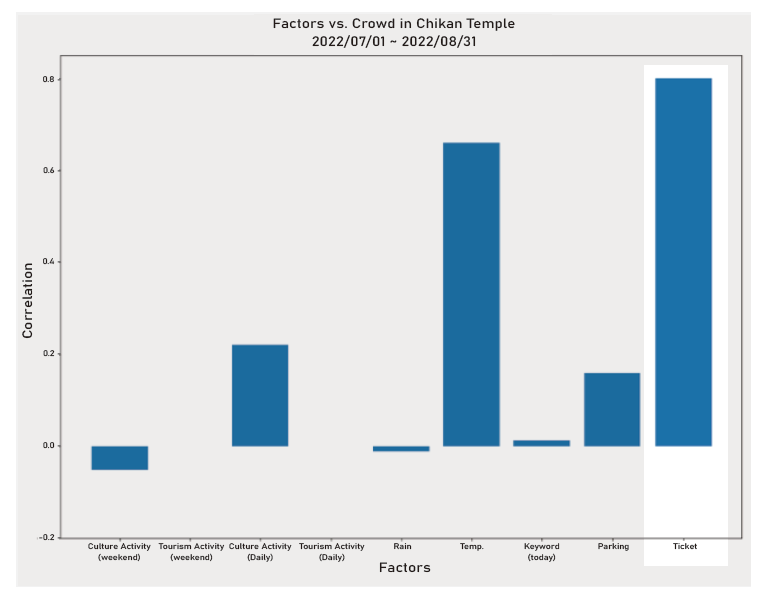
Since the ticketing information we obtained overlaps with the Far EasTone information only for the Chikan Park, we took the two columns of information and conducted a correlation analysis, which showed a correlation of +0.8.
The correlation analysis shows a clear trend:
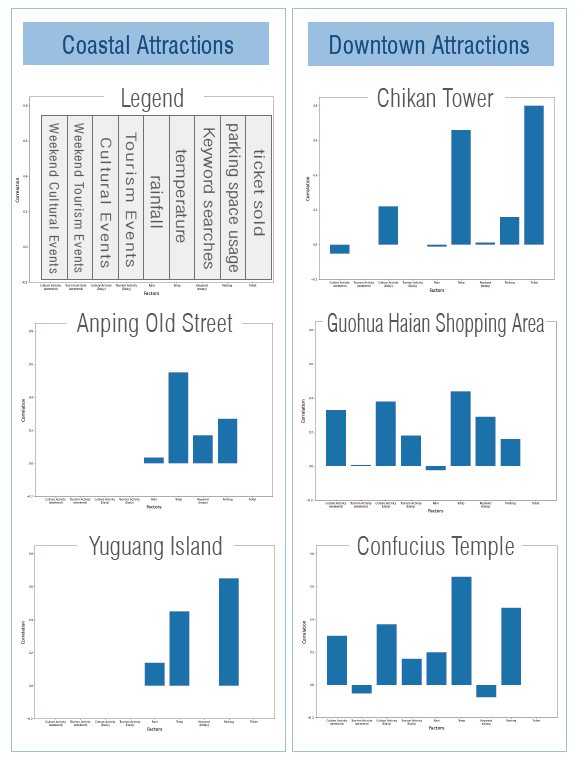
1. The temperature and the number of pedestrians showed a significant positive correlation, while cultural activities
showed a better correlation with the number of pedestrians.
2. As for the usage of parking spaces, there is a high correlation between the Confucius Temple and the Harborfront Axis, which means that tourists are more likely to choose on-street parking spaces in these two areas.
3. Keyword search volume for Guohua Haian Shopping Area and Anping Old Street strongly correlates with foot traffic. This suggests that online searches can indicate pedestrian trends in free(no admission fee), commercial tourist areas.
➍ Prediction Modelling
Input data: data before 48 hours
Predicted data: data after 5 hours
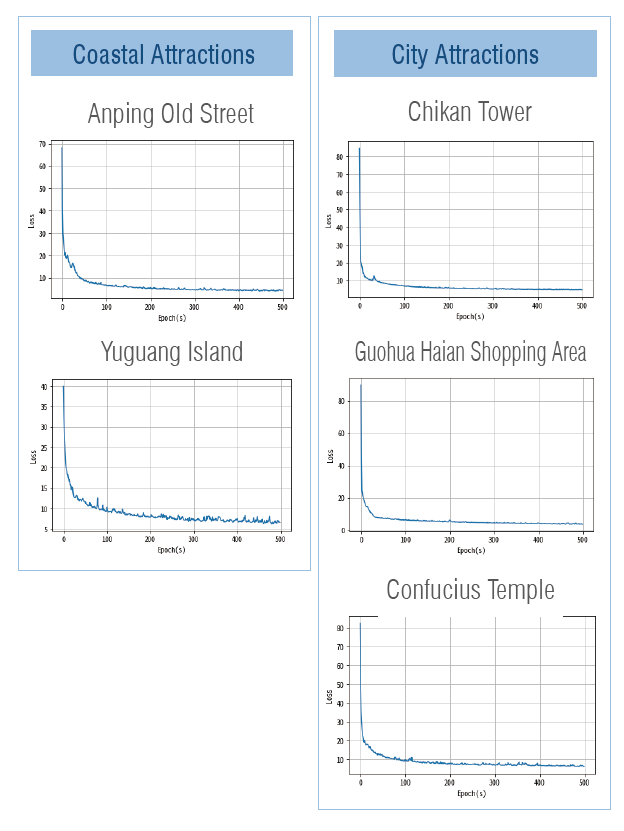
Model Parameters: loss func: MAPE / optimizer: adam
The model predicts the occurrence of future crowds for a single event and gives advance warning. All variables are included to predict the number of people at the five target attractions.
The left-hand drop-down menu lets user choose the data type and display format, such as area maps or dashboards. Administrators can further select specific data like historical intervals or predicted hours. The app’s UI is written in R using Shiny App and other packages to display Open Street Map data. Python files are called for training and prediction.
Demo Video

CrowdPrediction
CityScience, ComputerScience, Project
CityScope
CityScience, Project
SmartHygiene+
CityScience, Project
UrbanSight
ArchitectureDesign, CityScience, ExtendedReality, Project, Research
NonEuclidean Geometry
ExtendedReality, Project
